Studying automotive sensor data with Open Torque Viewer
I’ve been using Open Torque Viewer combined with the Torque App and a basic OBDII bluetooth sensor to log my car’s sensor data over the past month and a half. Here are a few things that I’ve learned:
Tapping into your car’s ECU is surprisingly easy
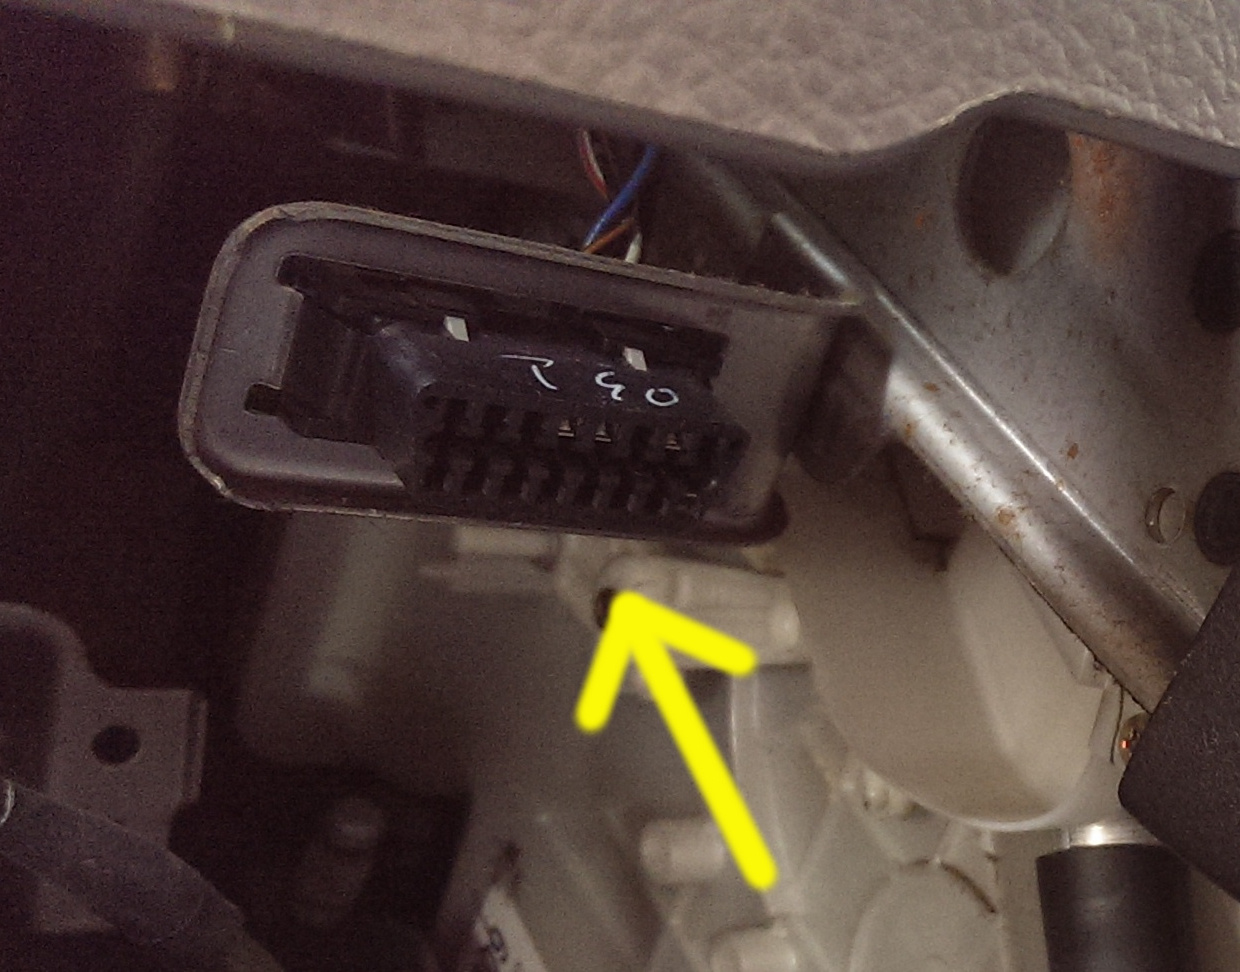
All cars sold in North America since 1996 are required to support OBD-II diagnostics with standardized data link connectors and parameter IDs. This is useful, for example, for state-mandated emissions inspections. The OBDII port looks a bit like a VGA connector and, on my car (a 2003 Suzuki Aerio SX), is located under the dash and just above the accelerator.
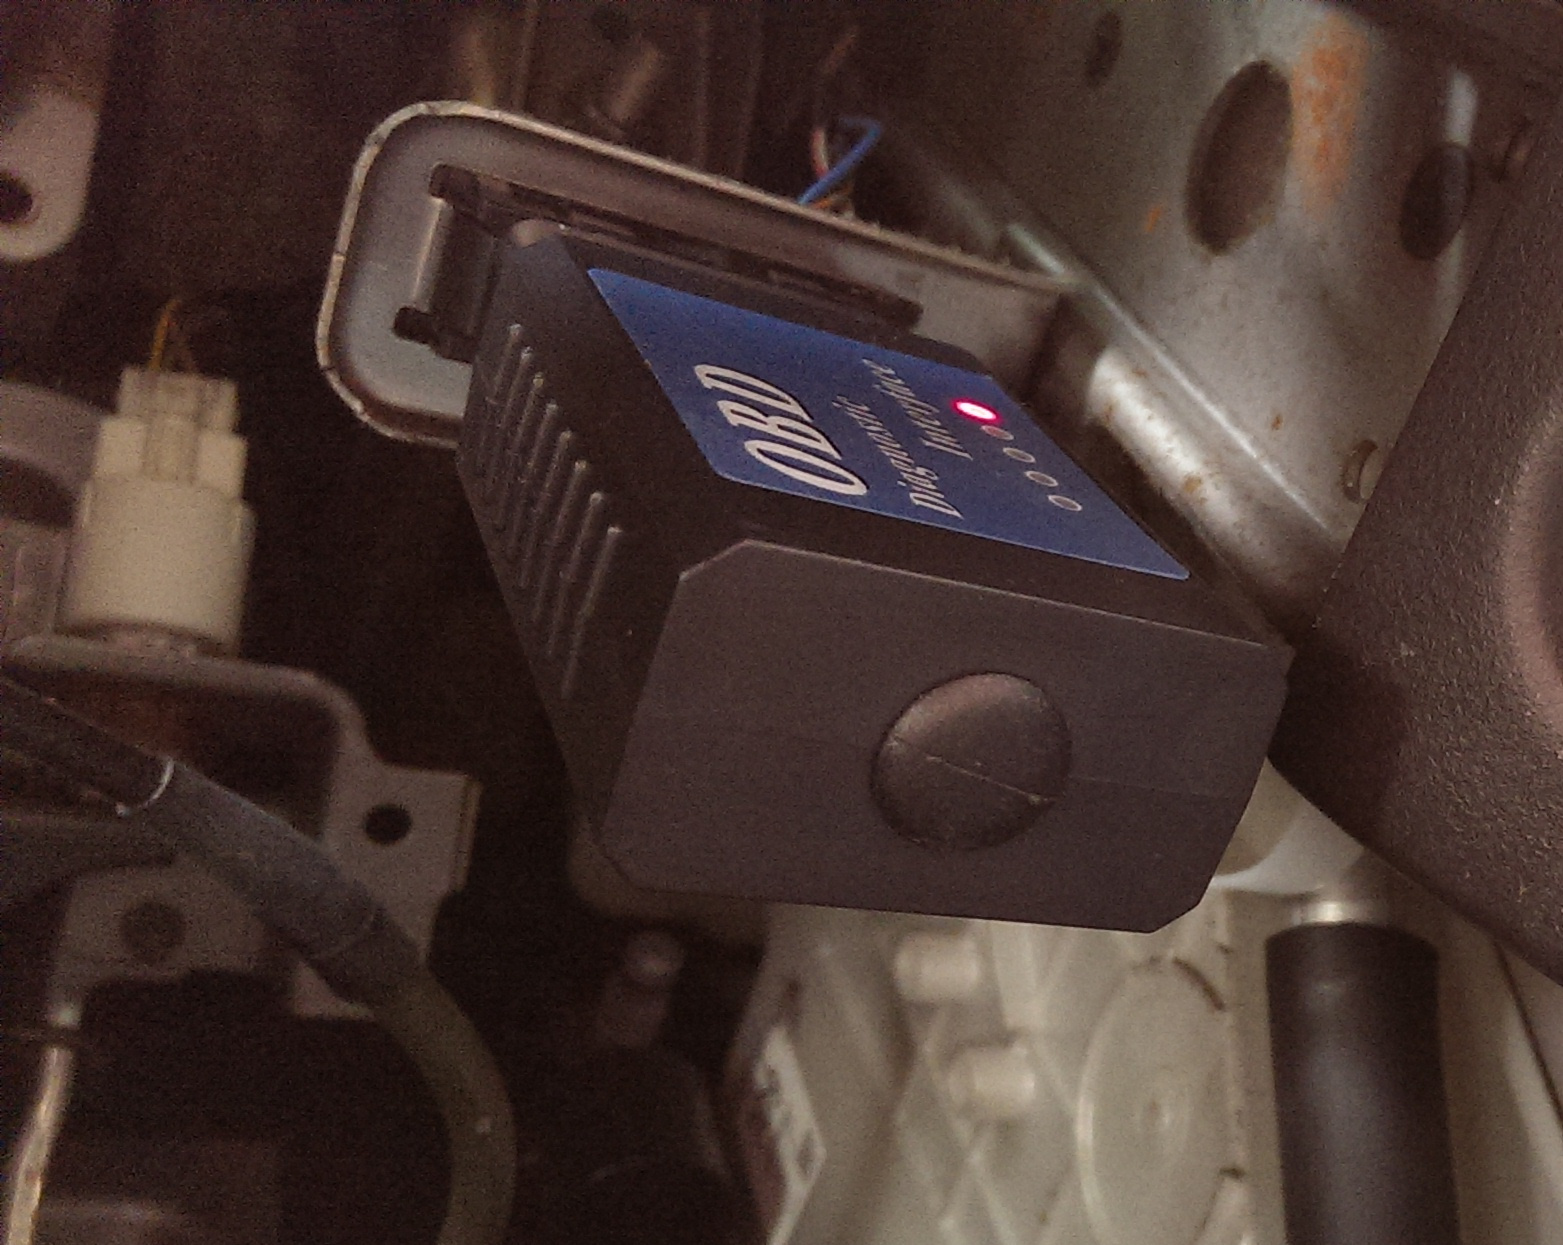
Attach a bluetooth OBDII device to the port, download the Torque app, setup Open Torque Viewer (I used an EC2 microinstance), and you’ll be able to log each trips data and display it inside of a nice interface. You can also learn about engine fault codes with this setup - I haven’t had any yet.
City mpg estimates are spot on for LA
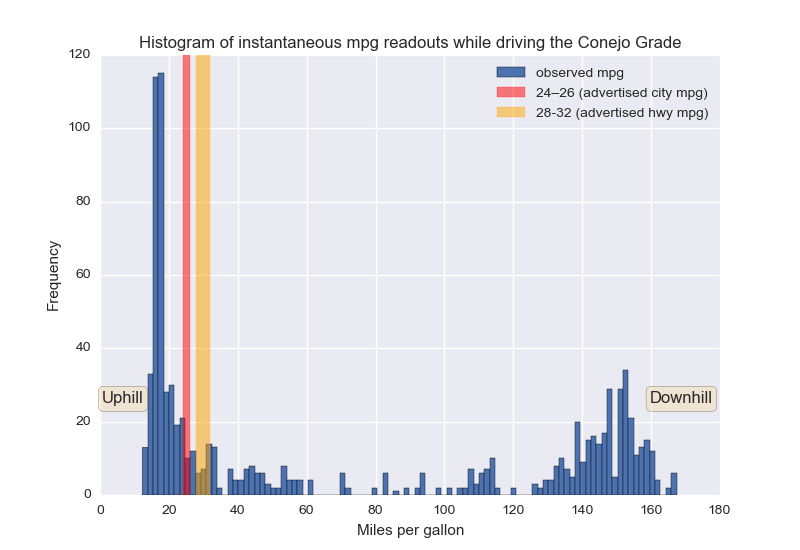
Torque provides readouts of instantaneous mpg data while you drive. I histogrammed this data and compared it with advertised values in the chart below.
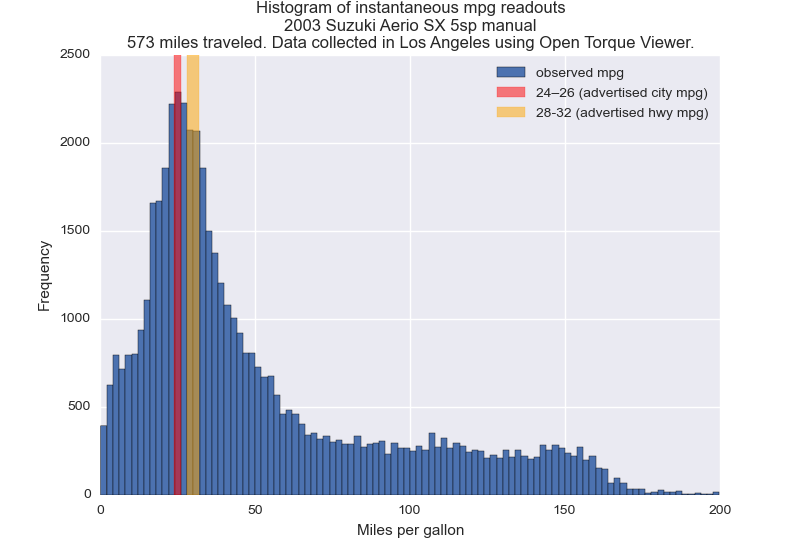
My driving fit the “city” profile reasonably well (even though I’m usually on a “freeway”). I was surprised that I was anywhere near the expected mpg given how unpredictable traffic is. Maybe the fact that Los Angeles is mostly flat and has rainless 75° weather year round evens things out.
Driving up the Conejo Grade is expensive
The Conejo Grade is a 7% grade incline on the 101 near the LA/Ventura county line. It’s around 5 miles long and has 3.5 stars on Yelp. Here’s a fun video of the trip up and down it. A mudslide shutdown PCH in mid-December (it’s February now and PCH is still closed…) so I’ve had to drive the Conejo Grade whenever I make a trip to Oxnard.
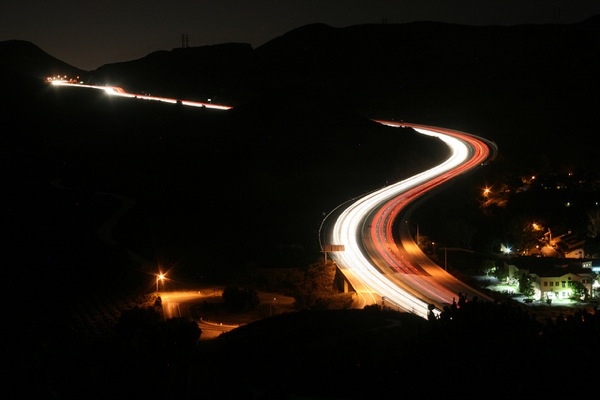
The Conejo Grade at night. | Photo: macmcintire/Flickr/Creative Commons License
I average 17.77 mpg on the uphill portion and 112.92 when going downhill. At \$3.50 a gallon this works out to \$0.98 in gas money to push myself up that hill and \$0.15 to coast down it. Here’s a histogram of instantaneous mpg measurements recorded on the Conejo Grade:
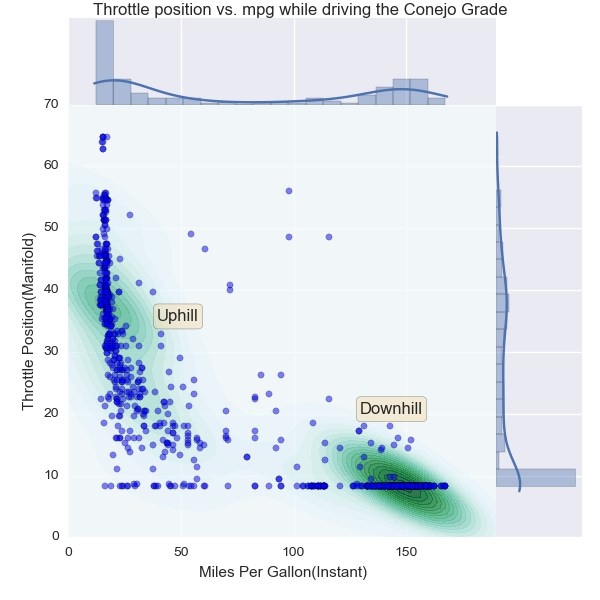
Torque also logs throttle position. I often get the pedal to the floor near the top of the incline. Adding a dimension for the throttle position variable makes the uphill/downhill distinction a bit more pronounced. The blobs are kernel density estimates computed by seaborn. The drastically bimodal nature of the data helps illustrate how hard I’ve got to press on the gas to get up that hill.
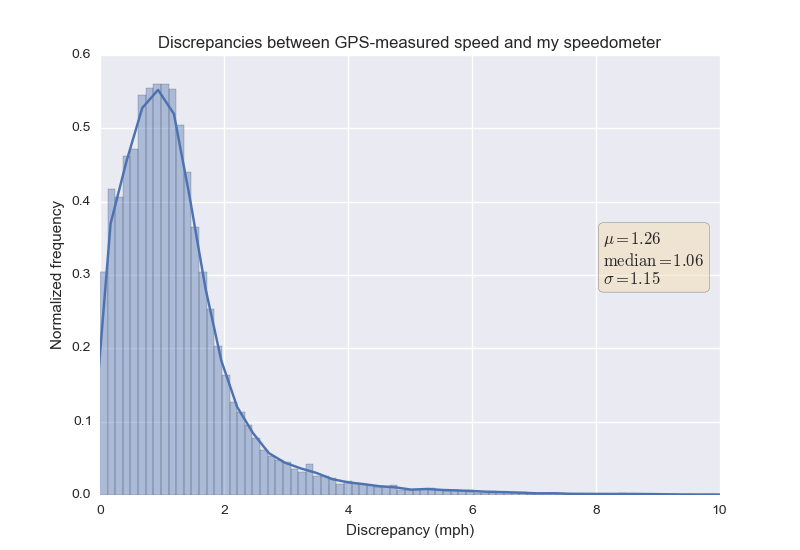
My speedometer is accurate
Here’s a plot of the discrepancies between my GPS-measured speed and what my speedometer is reporting. The mean discrepancy is 1.26 mph at a standard deviation of 1.15 mph.
Here’s a plot showing how the agreement gets a little better at higher speeds:
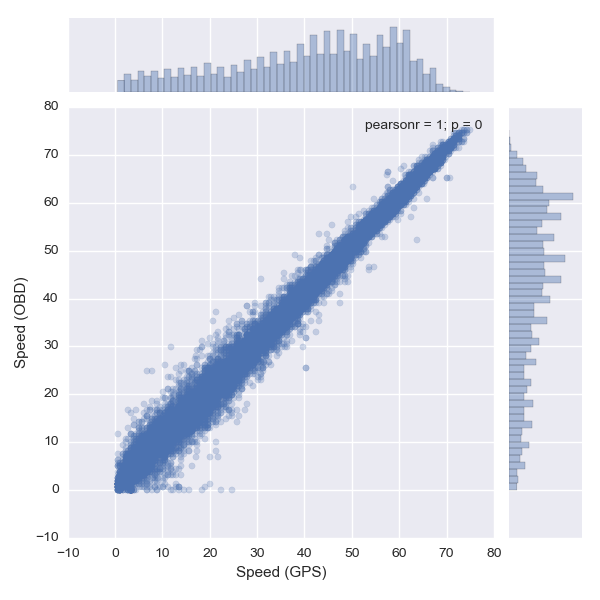
I suspect the reason for this is that my speedometer works better when I’m not braking all the time - I don’t think GPS measurements are affected by my driving.
Remarks
Open Torque Viewer is a lot more fun than dropping $100 at the mechanic to have them do basically the same thing when you come in for a check engine light. Here’s what the interface looks like:
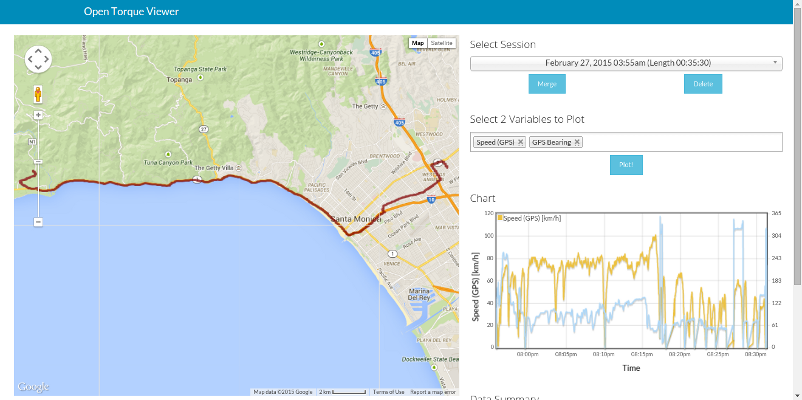
There are a few other apps out there that connect your smartphone to an OBDII device (e.g. dash or automatic ) but they seem targeted for simplicity and have lots of social-networking ick. I tried dash out but quickly switched back to Torque since its data collection and logging options are much more customizable. I don’t think this blog post would have been possible with any of the other apps out there.
The code used to make the plots is available as an ipython notebook.