Stochastic block model based edge bundles in graph-tool
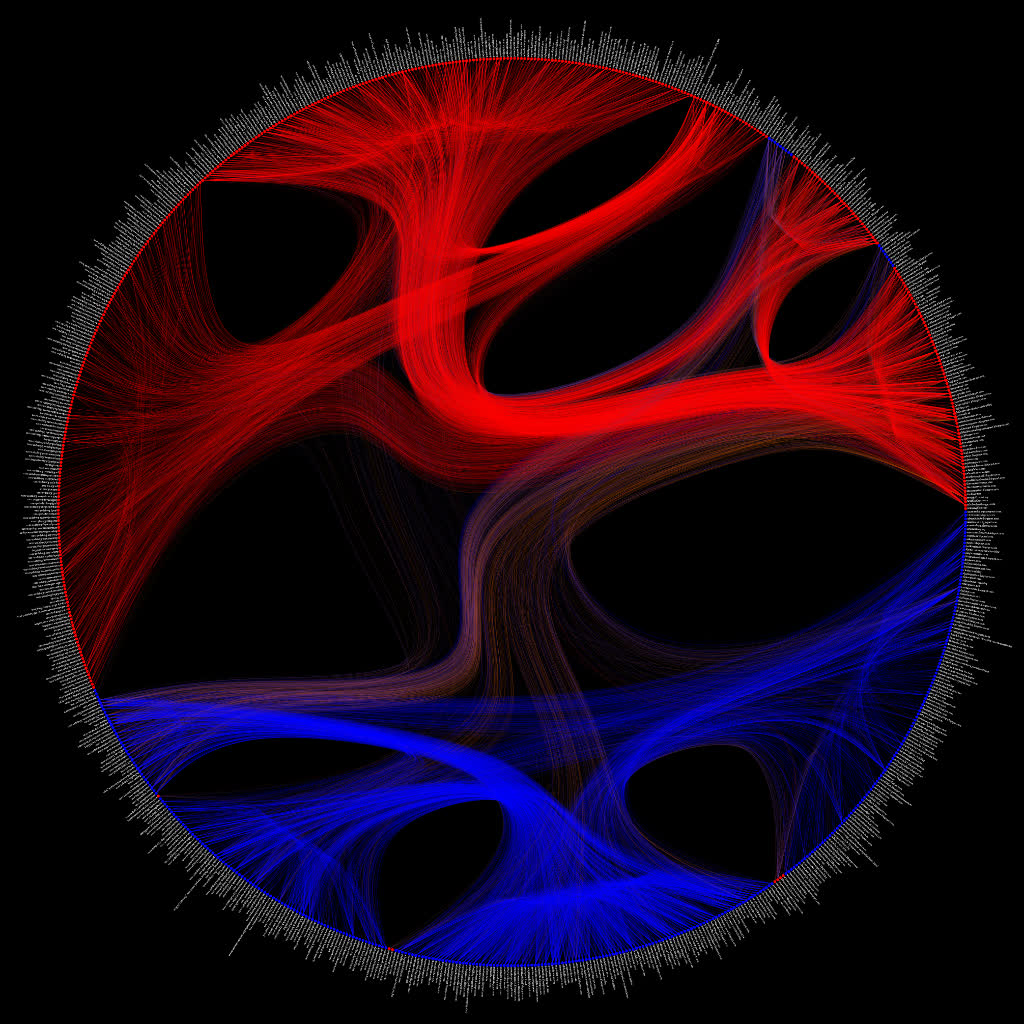
Here’s a plot of the political blogging network in “The political blogosphere and the 2004 US Election” but with the edge bundles determined using a stochastic block model (remark: the below plot is the same (ie. same layout and data) as fig. 5 in Tiago’s paper - I just put a black background on it).
The edge-color scheme is the same as in the original paper by Adamic and Glance, i.e. each node corresponds to a blog url and the colors reflect political orientation, red for conservative, and blue for liberal. Orange edges go from liberal blogs to conservative blogs, and purple ones from conservative to liberal (cf fig. 1 in Adamic and Glance).
Code and high-res version here:
# -*- coding: utf-8 -*-
import graph_tool.all as gt
import math

g = gt.collection.data["polblogs"] #  http://www2.scedu.unibo.it/roversi/SocioNet/AdamicGlanceBlogWWW.pdf
print(g.num_vertices(), g.num_edges())

#reduce to only connected nodes
g = gt.GraphView(g,vfilt=lambda v: (v.out_degree() > 0) and (v.in_degree() > 0) )
g.purge_vertices()

print(g.num_vertices(), g.num_edges())

#use 1->Republican, 2->Democrat
red_blue_map = {1:(1,0,0,1),0:(0,0,1,1)}
plot_color = g.new_vertex_property('vector<double>')
g.vertex_properties['plot_color'] = plot_color
for v in g.vertices():
    plot_color[v] = red_blue_map[g.vertex_properties['value'][v]]

#edge colors
alpha=0.15
edge_color = g.new_edge_property('vector<double>')
g.edge_properties['edge_color']=edge_color
for e in g.edges():
    if plot_color[e.source()] != plot_color[e.target()]:
        if plot_color[e.source()] == (0,0,1,1):
            #orange on dem -> rep
            edge_color[e] = (255.0/255.0, 102/255.0, 0/255.0, alpha)
        else:
            edge_color[e] = (102.0/255.0, 51/255.0, 153/255.0, alpha)
    #red on rep-rep edges
    elif plot_color[e.source()] == (1,0,0,1):
        edge_color[e] = (1,0,0, alpha)
    #blue on dem-dem edges
    else:
        edge_color[e] = (0,0,1, alpha)

state = gt.minimize_nested_blockmodel_dl(g, deg_corr=True)
bstack = state.get_bstack()
t = gt.get_hierarchy_tree(bstack)[0]
tpos = pos = gt.radial_tree_layout(t, t.vertex(t.num_vertices() - 1), weighted=True)
cts = gt.get_hierarchy_control_points(g, t, tpos)
pos = g.own_property(tpos)
b = bstack[0].vp["b"]

#labels
text_rot = g.new_vertex_property('double')
g.vertex_properties['text_rot'] = text_rot
for v in g.vertices():
    if pos[v][0] >0:
        text_rot[v] = math.atan(pos[v][1]/pos[v][0])
    else:
        text_rot[v] = math.pi + math.atan(pos[v][1]/pos[v][0])

gt.graph_draw(g, pos=pos, vertex_fill_color=g.vertex_properties['plot_color'],
            vertex_color=g.vertex_properties['plot_color'],
            edge_control_points=cts,
            vertex_size=10,
            vertex_text=g.vertex_properties['label'],
            vertex_text_rotation=g.vertex_properties['text_rot'],
            vertex_text_position=1,
            vertex_font_size=9,
            edge_color=g.edge_properties['edge_color'],
            vertex_anchor=0,
            bg_color=[0,0,0,1],
            output_size=[4024,4024],
            output='polblogs_blockmodel.png')
The high-res version is available here.